A snapshot of key fund data, performance, and portfolio characteristics.
Top 10 Positions & Portfolio Concentration
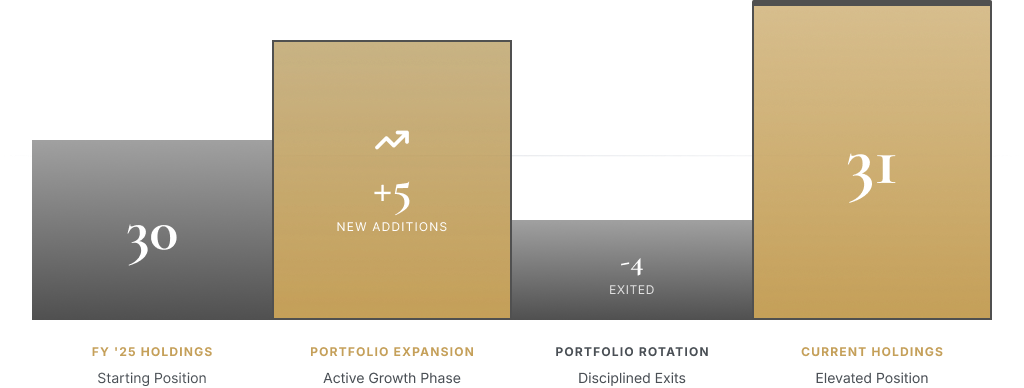
We analyze how portfolio expansion impacts concentration within the top holdings.
PORTFOLIO CONCENTRATION
Holding Growth
Portfolio holdings increased from 30 to 31 following 5 new additions and selective portfolio exits.
+5 Additions
-4 Exited
Net Growth +1
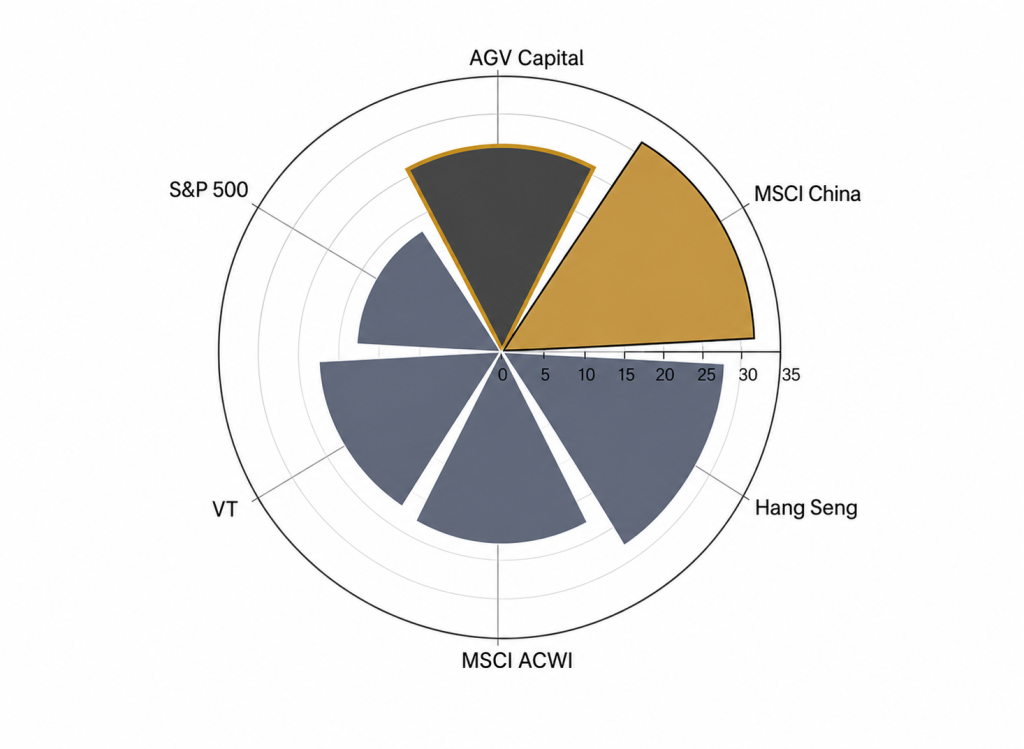
Performance (2025 Return)
AGV CAPITAL
26.3%
MSCI China
31.4%
Hang Seng Index
27.8%
MSCI ACWI
22.9%
Vanguard Total World (VT)
22.4%
S&P 500
17.9%
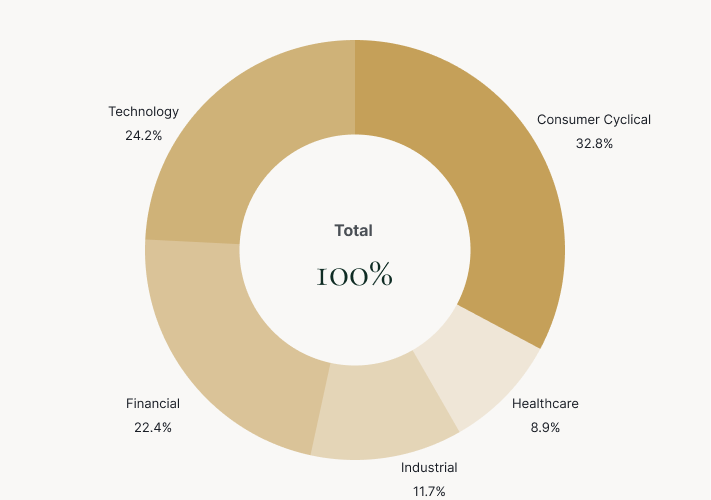
Sector Allocation
Consumer Cyclical
32.8%
Technology
24.2%
Financial
22.4%
Industrial
11.7%
Healthcare
8.9%
TOTAL
100%
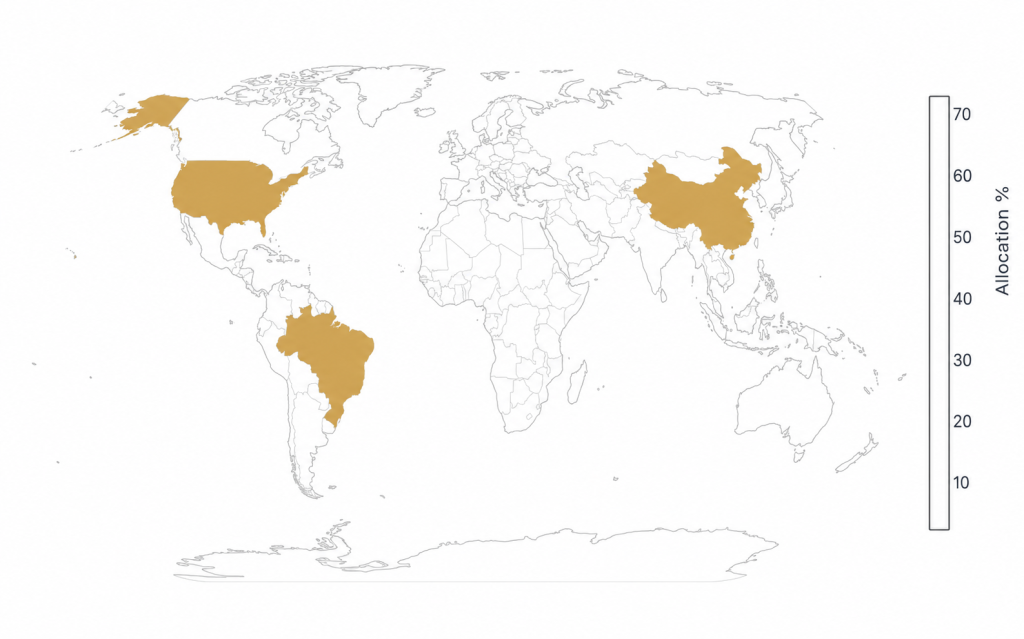
Geographic Exposure
A visual representation of portfolio allocation by geography.
Allocation Breakdown
China
69.8%
USA
13.8%
Brazil
5.0%
Netherlands
3.3%
Canada
2.9%
Denmark
2.7%
Mexico
2.2%
Kazakhstan
0.3%
Total
100%
COLOR LEGEND
No exposure
High exposure
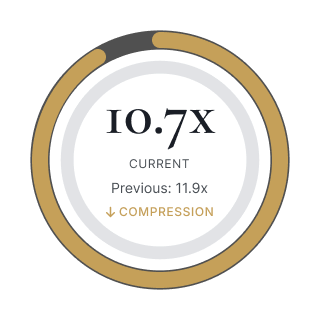
Valuation Multiples
Price-to-Earnings (P/E)
FY '24
FY '25
P/E MULTIPLE
11.9x 10.7x
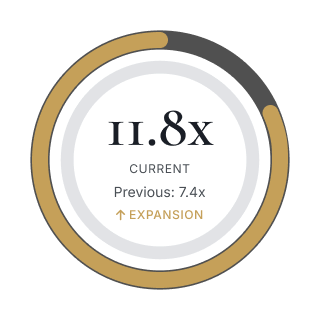
Price-to-Free Cash Flow (P/FCF)
FY '24
FY '25
P/E MULTIPLE
7.4x 11.8x
Earnings multiples moderated while free cash flow valuation expanded between FY ’24 and FY ’25.
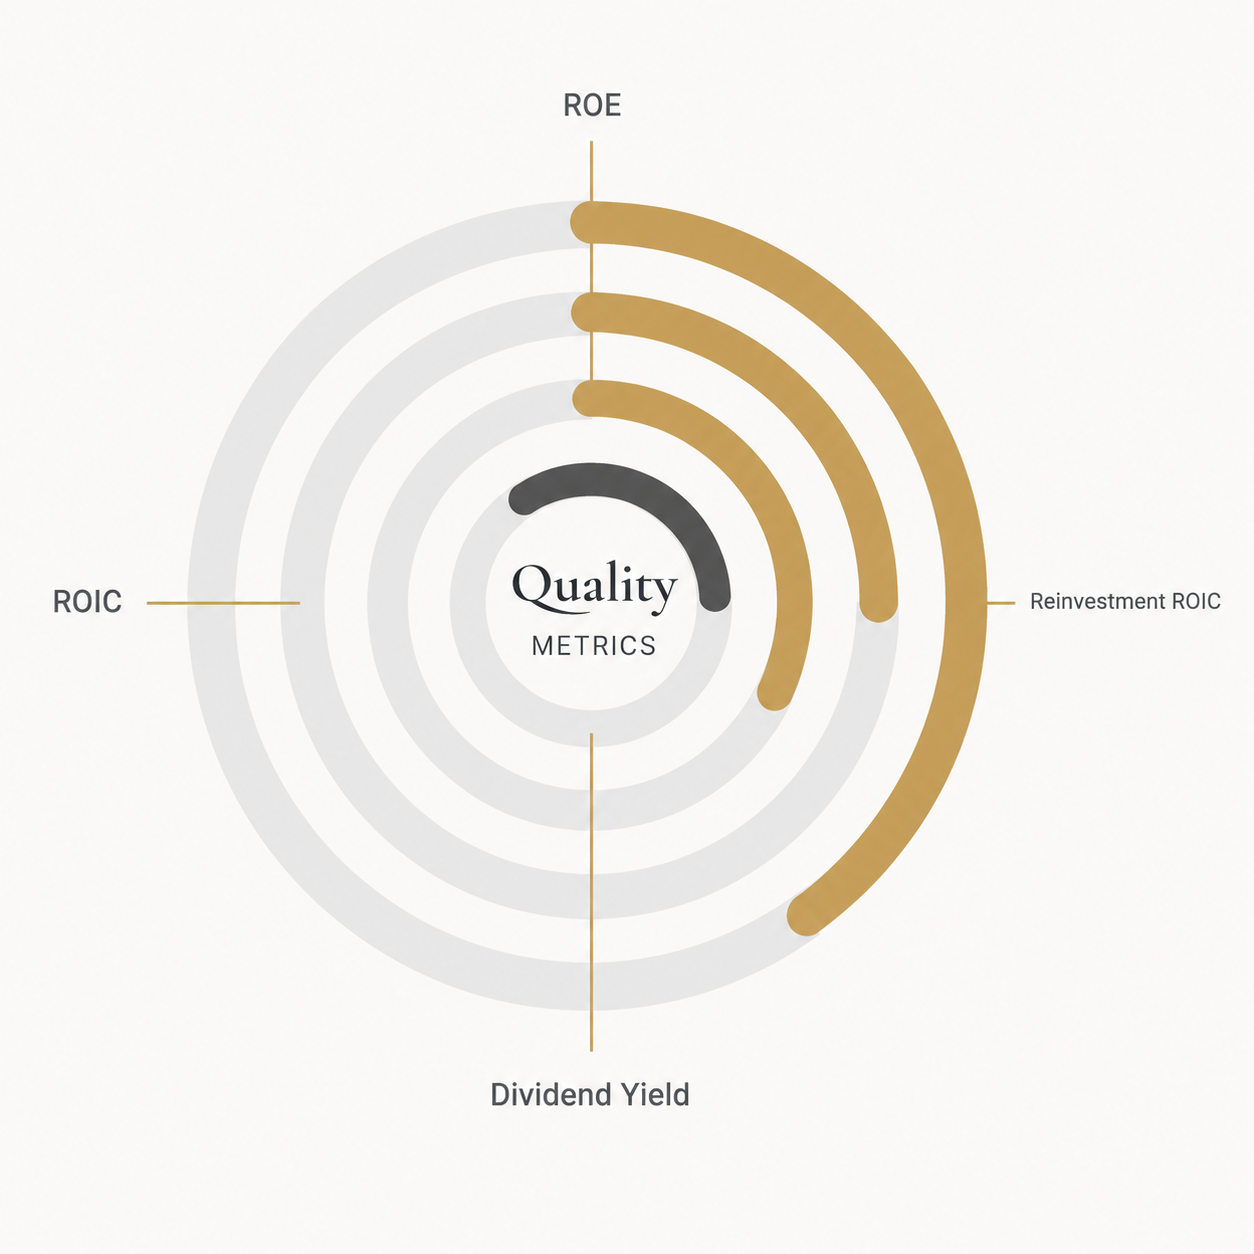
Portfolio Quality Metrics
ROE %
FY '24 → FY '25
17.8% → 22.3%
ROIC
FY '24 → FY '25
13.9% → 13.3%
Reinvestment ROIC
FY '24 → FY '25
24.6% → 30.4%
Dividend Yield
FY '24 → FY '25
3.5% → 2.9%
FY '24
FY '25
Portfolio quality remained strong, with notable improvement in reinvestment efficiency and return on equity.
Growth Metrics (Year-over-Year)
EPS GROWTH
31.0%
REVENUE GROWTH
30.1%
Disclaimer
FY’24 and FY’25 multiples are calculated using share prices as of December 31, 2024 and December 31, 2025 respectively.
Financial metrics reflect the trailing twelve months (TTM) ended September 30, 2024 and September 30, 2025 respectively, based on reported filings available at the time of calculation.